At the end of this year, I gave myself a target of pocketing $1100 of dividend. After the last wave of results for all my companies, I have collated the dividends received and in 2017, I have received a total of $1083.87. A little shy of the $1100 target!
Achieving this target was not easy in 2017 as one of my core holdings, Singapore Post, decided to peg dividend payout to earnings rather than a fixed rate. SingPost paid out $0.065 of dividend in 2016 compared to $0.020 in 2017. I patched this hole mainly by deploying more capital this year and scoring a buy in Silverlake Axis. Silverlake Axis has its best dividend yield for years due to its divestment of GIT, with a $0.048 payout or 8.18% according to StocksCafe. Myself, I reaped a 7.19% dividend yield as I missed the first payout this year.
Other notable stock was Karin Tech where it distributed 10.28% of dividend. I have absolutely no idea how they maintain this level of dividend till today, but it is still serving me well despite many years of skepticism.
All said and done, I am satisfied getting more dividends this year and all this was to ensure that I can increase my dividend gradually and eventually able to reap enough passive income to be financially independent. You should starting working on yours too!
Showing posts with label dividend. Show all posts
Showing posts with label dividend. Show all posts
Saturday, 18 November 2017

Sunday, 1 January 2017
2016 Investing Report Card
Year 2016 Closes, Results and Returns
2016 closes and with SGXcafe calculating returns on a daily basis, I knew what was coming before the year ended. Disappointingly, my portfolio underperformed STI ETF returns this year - the first time since 5 years of investment. With the negative losses last year, it was quite disappointing to have not grown my investment this year as well.2016 Portfolio XIRR: -2.215%
STI ETF XIRR: 2.864%
Fun Facts
For now, let's lighten up the mood for some infographic about my portfolio movement this year:
Dividends Goals
With regards to $1000 the dividend goal I had set for 2016, you can see that I have narrowly missed it with $954.25. This partly due to Singpost's tightening dividend policy as well as Falcon Energy not yielding any dividend this year.For 2017, I hope to increase my dividend received to the tune of $1100. Building up a portfolio that can gives me a steady income stream is one of my retirement goals for the long long term, and I hope that I am able to slowly accomplish this goal.
To increase the dividend, one way is to focus on purchasing stocks that are dividend-yielding and have the cash flow to support it. Monthly investment in STI ETF with my siblings will also contribute in a minor way, probably to cover the shortfalls from the dividend cut by Singpost.
Going Forward
Despite these two years of negative returns, I aim to keep the course. But it has certainly made me re-assess the way I look at gains. A problem is me not realizing profits only to watch it slip away and never coming back. One part of me always wants to be noble and be a "long-term investor". The other part is Graham's and Buffet's mantra of only buying companies where you will never give it up. Falcon Energy has been a bummer and I hope it proves itself in 2017.
For further pickings, I have a few stocks in my mind for research and considerations. Working gives me an steady income to invest but it takes time away from research and homework. But I hope to stay the course and just keep moving ---- towards financial freedom!
Monday, 16 May 2016
DRP Calculations - Maximize your Dividends!
In a previous post, I had talked about the positive and negative aspects of Dividend Reinvestment Plan, or DRP in short. A key positive for DRP is the compounding feature which allows you to reinvest your dividends and snowball your assets. However, in the process subscribing for DRP, some of the dividends will be wasted due to roundoff calculations. This post teaches you how to allocate shares between DRP and cash so as to minimize wastage.

The cells in orange need to be filled up by the user. The dividend structure is that of the example I shown at the top. The issue price of new shares is what you will be paying for using the dividend received. It is usually priced at a discount and announced separately later. In this case, it is $0.9802.
Suppose I have 3000 shares of Keppel Reit and I allocate it entirely to DRP, I will receive 49 new shares in total. However, if i decrease it by 1 share, I will still receive the same amount. Hence your objective is to find out what is the lowest Shares allocated to DRP so that the maximum new shares is still received then assign the remaining to receive cash.
First off, dividends declared.
Suppose your company has a DRP program and you want to subscribe to it. As an example, Keppel Reit declares a dividend and announces it on SGX website. This dividend consists of a few components such as taxable income, tax-exempt income distribution, capital distribution and other gains.
During my first attempt to claim scrip dividend, I learnt that new shares issued are counted not based on the lump DPU of 1.68 cents but instead, counted separately under each component and then summed together. This presents a problem as roundoff calculations are repeated at each component and it really eats into your allocated dividend. All the more important that you maximize your scrip dividends!
So how to maximize?
Subscribing to DRP does not deprive you of cash dividend; you can do half-half. Basically in the DRP form you receive, you will be asked to allocate how much of your shares holding to count for cash dividends and how much to count for scrip dividend.
Here lies the method to maximize your dividends:
- Allocate the minimum number of your shares holdings to DRP such that the new shares issued to you is the maximum
- Allocate the remaining shares holdings to receive cash
Example
Below is the Google sheet I created to address the above steps and you can download it here.
The cells in orange need to be filled up by the user. The dividend structure is that of the example I shown at the top. The issue price of new shares is what you will be paying for using the dividend received. It is usually priced at a discount and announced separately later. In this case, it is $0.9802.
Suppose I have 3000 shares of Keppel Reit and I allocate it entirely to DRP, I will receive 49 new shares in total. However, if i decrease it by 1 share, I will still receive the same amount. Hence your objective is to find out what is the lowest Shares allocated to DRP so that the maximum new shares is still received then assign the remaining to receive cash.
Cost Savings?
Between 3000 shares and 2949 shares (which is the optimal) to DRP, there is an extra $0.85 that can be saved. This may be insignificant but it is a matter of principle to me. For others, that 10 minutes to save this $0.85 is worth it.
Hopefully this post will save a lot more $0.85 going forward. If you know people doing DRP, do forward this post to them.
Thursday, 21 April 2016
I'm selling HPH Trust (NS8U.SI)
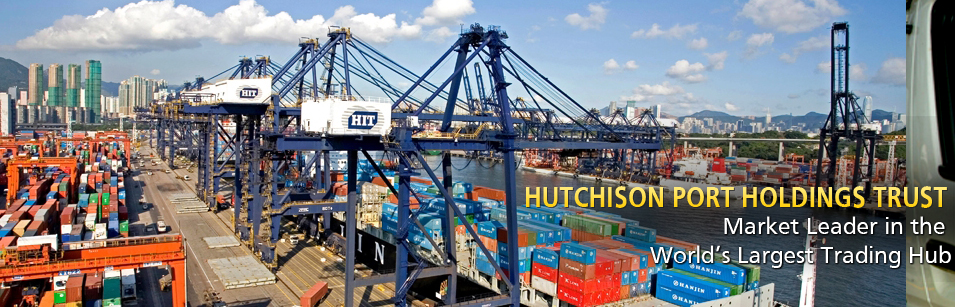
Following HPH Trust's result announcement, I've finally decided to part ways with this stocks. In many posts here, here and notably here, I had voiced concerns about the sustainability of the dividends payout and the effect of China's slowdown. Unfortunately, due to procrastination and the time taken up by school work, I was unable to followup with a review of HPH Trust. On top of the 26% drop in underlying NPAT attributed to shareholders, this announcement also came with a very jarring note which stated it is:
"...repaying a minimum of HK$1 billion of debt annually beginning in 2017"

Dividend Issue
Woah, hold it right there. The amount is no small sum at all. Taking 2015's distribution amount which comes up to HK$2996.6 million or 34.40 HK cents per share, repaying HK$1 billion per year will cut this distribution amount to 22.92 HK cents or 33.3% drop!! Now, this is just purely assuming that the repayment solely comes from the hand dipping into the distribution income. Some might be taken from its existing cash pile...?But take a look at Total Consolidated Cash at 31 March 2016: $5,995.6
It's not much at all. Keep in mind that HPH Trust need $1 billion per year for 5 years, not to mention servicing of short term debt. Another consideration is the dropping NPAT attributable to shareholders (no time to consolidate data, sorry!), which will eventually lead to decreased DPU. 2015's yield was exactly 8.0% based on my purchased price of US$0.68. Given that the first half of the dividend had already dropped 14%, the forecasted yield based on my purchase price is around 6.8% for this year. Conservatively taking out another 20% drop in DPU because of debt repayment, the dividend yield in 2017 will be just 5.5%!!. I had mentioned that my comfortable level was actually 6.5% and this violated my reason to buy/hold HPH Trust.
Will it fit into my portfolio?
5.5% is a decent dividend for any stocks and the fact that STI is one of the top dividend yield index in the region may just be because of HPH Trust! However, does it justify a place in my portfolio after all? I'll be using a concept I've learnt in my FIN3101 class (hello Prof Ruth!) - the Modern Portfolio Theory.
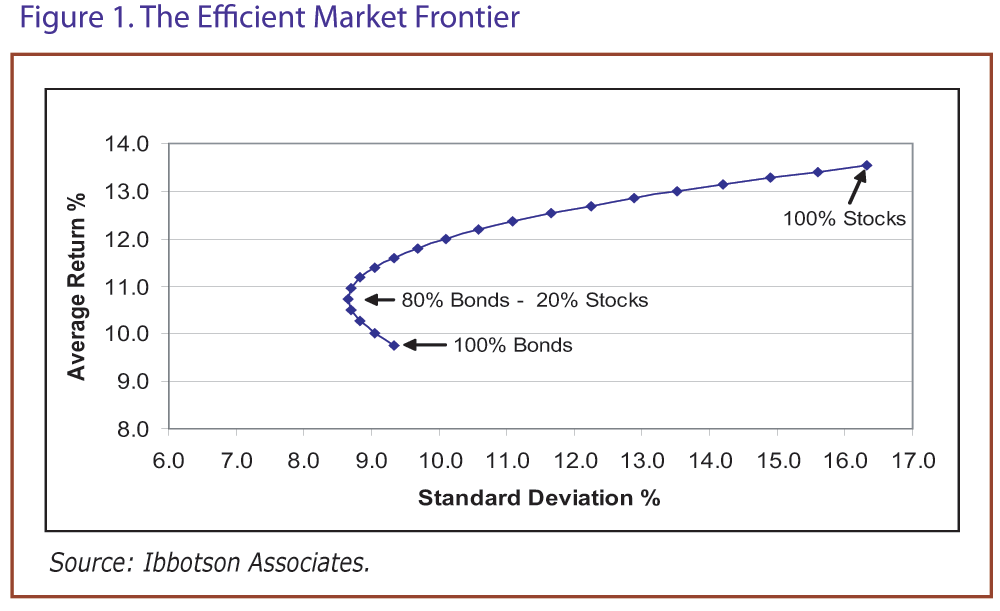
I'm not going to explain in details about this concept, but in general it is about using diversification to bring the risk of a portfolio down to your acceptable level and get the best expected returns, through varying the weights of your portfolio components.
To cut to the chase, I had actually found that by removing HPH Trust from my portfolio, the standard deviation or risk of the portfolio did not change and it was actually accompanied by a marked increased in expected mean return of the portfolio. This essentially signified that HPH Trust did not contribute to my portfolio in terms of risk and was actually detrimental in terms of expected returns.
This was actually my first time using this method to analyze my portfolio and I was excited to find out about this fact! The photo below shows my calculation and any guru that may come by this humble blog can double check my workings.

Seeing that future dividends are going to be cut and finding out that HPH Trust is useful in my portfolio, I have decided to sell this stock. Queued at US$0.465 all day to no avail, I will continue to try tomorrow or at least in the immediate term.
Monday, 18 January 2016
Karin Technology Holdings (K29.SI)
 |
| http://www.karingroup.com/eng/images/global/home_logo.gif |
Business
Karin Tech is a leading electronic and industrial components distributor and providor of IT solutions, as well as outsourcing service provider in Hong Kong and China. In 2011, Karin included retail arm to its operations, opening four In-Smart stores in Hong Kong. . Though the business sounds unappealing, the surprising fact is this:
Since 1977, the company had always been in profit!
The company did not enjoy continuous EPS growth as its earnings were affected in the wake of 2008 GFC and in 2014. However, the fact that the board was able to maintain profitability despite many economic downturns is indeed commendable. The company also has a substantial economic moat due to its very diversified business. Listed on its Products & Services, Karin Tech looks like a semiconductor company and a IT solutions provider. Throw in the retail arm, Karin Tech has a hand in every section of the technology sector. The business not as exciting as companies like Apple or even Foxconn, but I particularly like companies that no one pays attention to.
Dividend
Business aside, let's look at the company's past dividends. The most attractive part of Karin Tech is actually a dividend yield that matches REITs and Business Trusts. Below is the dividend yield for 2013, 2014 and 2015.
| Year | Dividend (S$) | Closing Price for Year | Dividend Yield |
|---|---|---|---|
| 2013 | 0.0264 | $0.33 | 8.00% |
| 2014 | 0.0228 | $0.30 | 7.60% |
| 2015 | 0.0313 | $0.31 | 10.10% |
As you can see, the dividend yield for Karin Tech is substantial and comparable, if not better than many dividend stocks out there. Another point to note is the closing price for each year. Notice that the price is not volatile at all. Hence if you would are okay about not chasing capital gains but settle for dividends, Karin Tech is indeed very appealing.
As with all dividend, one have to check how sustainable the dividend policy is. Below is the graph of how dividend payout correlates against EPS of the company. From the graph, you can see that management had discipline in keep dividend payout in line with EPS. Dividend payout average at approximately 50% throughout the years. Therefore, the dividends are indeed sustainable and payout are strictly adhered to by the management.


Valuation Metrics
From Yahoo website, the P/E of Karin Tech currently stands at 8.16. For a company that is relatively low profile with not as "attractive" business, I would say that the P/E is reasonable but leaves room for upside. For P/B, I referred to POEMS Stock Analytics and yield a figure of 0.56. Both P/E and P/B indicated that the margin of safety is relatively large. A downside I identified is actually how the stock rolls with the dividend payout. For example in 2010, when 8.2 HK cents of dividend was paid, the year end price was $0.22 - 6.5% yield (ignoring currency). Market historically had priced this stock to yield high dividend, which means that upside might be limited as well.
A catalyst that warrants a share price increase is the fact that HKD, by proxy of USD had already increased against SGD. Since HKD is pegged to USD, the stronger USD meant that the earnings of the company will be higher. Also, dividends paid out by the company is denominated in HKD, which might potentially mean higher payout. Most of the time, I feel that the market do not pay much attention to currency exchange (maybe because the companies always strip of forex gain/loss anyway) but in this case where dividend is transacted in HKD, perhaps this Karin Tech might be worth a look.
I'm none the wiser about the general strength of the industry. However, judging from the slowing economy in China, perhaps Karin Tech might be negatively affected by it. But, it is definitely worthwhile to note that the strength of management will make me comfortable holding the stock long-term and ride out downturns with them, all the while collecting the dividends they give out.
Valuation
The historic EPS growth between 2004 and 2015 was 5.87% annually. Projecting CAGR forward, the EPS in 2017 will hit 0.3295 HK cents or approximately $0.06. Applying the same P/E of 8, the simple projected price of Karin in 2017 should be around $0.48 (share increase in excess of 50%).The current value arrived using Gordon Growth Model is looks even more monsterish. From Reuters, the beta of Karin Tech is 0.21. Re-using the risk-free rate and market's rate of return from previous post, the required rate of return or discount rate amounts to 3.465%. In 2005, the dividend was 6 HK cents while in 2015, it was 17.6 HK cents. Taking into account that 2015 was a record profit year, I will slightly adjust the "ending" dividend to 15 HK cents. Thus in the span of 10 years, the dividend growth of Karin was 9.6%. If you realise, the discount rate is actually lower than dividend growth and hence lead to a negative stock price (technically not possible).
Hence, an alternative will be to lower expectations and change using Constant Dividend Growth to valuate the company. Let's lower expectations even further and assumed that the upcoming year's dividend is 10 HK cents (44% drop). Using the formula, the current stock price for Karin Tech should be HK$2.89 or S$0.52.
Conclusion
From the valuation section, you can see how horrifyingly undervalued Karin Tech is. However, there are some issues to consider. One would be the continuation of business and dividend. Will dividend continued indefinitely? Is the survival of business a cause of concern? Perhaps the growth of the entire business will be in jeopardy in the near future due to slowing economy of China.However:
- P/E and P/B are very low, similar to unfavoured industry. Given that it is a high dividend yield stock, I think it should command higher valuation
- Business had always been profitable. Good economic moat
- The company had been faithfully declaring dividend for the past 10 years
- Recent hike in US$ (of which HK$ is pegged to) against S$, translating to higher dividend
Given all these reasons, I think Karin is a safe bet and have taken a small position.
Saturday, 16 January 2016
2015 Investing Report Card
In my previous post, I mentioned that my "financial year" ends on 13 January 2016, since it was the date I started tracking 2015 investment returns. Now that the day had past and I finally handed in my Final Year Project report, I can finally sit down to type out this post!
2015 Annual Return: -10.412% (for year ended 13 Jan 2016, using Excel's XIRR function)
With a portfolio that is down more than 10%, it was definitely not a good year for me. The consolation is that using the same calculation metric, the 2015 return for STI ETF was actually -16.099%.
Hence comparing my portfolio against the STI index, I had technically "beat the market" for the year of 2015. Since many books had mentioned professional fund managers have trouble beating the market, I take pride that I had achieved the feat in 2015. It was a tough year especially with China's economy not doing well and oil price being so depressed. As a graduating student, I can sense that Singapore's economy is not doing well at all. This is so because of the tight job market available for me. My wish for 2016 is for me to get a job and start my own monthly investment plan, putting a part of my salary in STI ETF. I do not mind that the stock market tanks because over the long term, buying in a bear market inflates your returns. Buy when others are fearful!!
Note: Recently, someone introduced me to Holding Period Return as a way to calculate portfolio return, instead of XIRR. I am still not sure which is more accurate. Hence for 2016, I will keep track of my investments using both methods and observe how far they deviate from each other.
Here are some of the fun facts about my portfolio performance in 2015:
2015 Annual Return: -10.412% (for year ended 13 Jan 2016, using Excel's XIRR function)
With a portfolio that is down more than 10%, it was definitely not a good year for me. The consolation is that using the same calculation metric, the 2015 return for STI ETF was actually -16.099%.
Hence comparing my portfolio against the STI index, I had technically "beat the market" for the year of 2015. Since many books had mentioned professional fund managers have trouble beating the market, I take pride that I had achieved the feat in 2015. It was a tough year especially with China's economy not doing well and oil price being so depressed. As a graduating student, I can sense that Singapore's economy is not doing well at all. This is so because of the tight job market available for me. My wish for 2016 is for me to get a job and start my own monthly investment plan, putting a part of my salary in STI ETF. I do not mind that the stock market tanks because over the long term, buying in a bear market inflates your returns. Buy when others are fearful!!
Note: Recently, someone introduced me to Holding Period Return as a way to calculate portfolio return, instead of XIRR. I am still not sure which is more accurate. Hence for 2016, I will keep track of my investments using both methods and observe how far they deviate from each other.
Here are some of the fun facts about my portfolio performance in 2015:
- Dividends are probably the reason why my portfolio managed to outperform STI ETF - receiving $863.19.
- Dividend yield for portfolio is 4.80%, Excluding stocks that did not give dividend, the yield goes up to 6.17%.
- I'm not a perfect investor. I trade sometimes (or technically, gamble). With 5 sets of Buy-Sell trades, I made a loss of $438.45. Portfolio return would have been better if my hand had not got itchy.
- Narrowly missed losing a whole lot more if I did not sell Ezra in time. Ezra closed at $0.0900 that same day.

- 2015 was also a bad year because none of the stocks I bought for investment purposes finished the green. Stocks included K-Reit, k1 Ventures and Straco. The only positive investment which I sold off was Apple Inc, which I bought in 2014 and sold in March 2015.
2015 was an overall bad year while 2016 remains uncertain and volatile. Within the first 2 weeks, STI had already dropped 8.46% and the future of oil rigs giants KepCorp and SembCorp look threatened. Having started investing in 2011, I have not met any bear market or recession. No one can claim to be "experienced" if he/she have not gone through a financial crisis. Hence I am actually excited for 2016! Bull or bear, I will still be in the market, seeking my private returns.
Sunday, 3 January 2016
My Stock Holdings (December) & Happy New Year 2016!

2015 stock market closed without a bang, neither a plunge. But it's undoubtedly a bad fairly lousy year. Starting the year at 3370.59 and ending it at 2893.19, STI dropped 14.16% excluding dividends. Oil price had bottomed to a 11-year low and does not seem to be recovering any time soon. Relevant companies in the oil industries had taken a hit, in particular Keppel Corp and SembCorp.
In my own portfolio, SingPost dropped almost 8% partly because of its CEO's departure and corporate governance problems. In my previous posts on SingPost, I mentioned how much I admired Wolfgang Baier's leadership in transforming SingPost. Now that he is actually gone, a closer watch on SingPost's performance in e-Commerce will be warranted.
Consistently under-performing stocks in my portfolio will also be reviewed soon. (once I submit my FYP report) These stocks actually include Bank of Ireland (BKIR) and HPH Trust. Since buying them almost 2 years back, they had returned almost zero returns. In fact, accounting for inflation and further brokerage fees and foreign custody fees, they were probably negative returns. In the long term, I am pessimistic about HPH Trust since there is little impetus for the share price. Management guidance of allowing dividend payout to follow cash flow should further compress dividend yield. For Bank of Ireland, there should be a slow recovery of its business towards declaring dividend late 2016 or early 2017. However, holding BKIR incurs foreign custody fee at POEMS and it is very vexing. Given the time, I would love to assess whether switching out BKIR and HPH Trust are preferable. (using capital budgeting concepts I learnt in FIN2004X!)
Rounding the "My Stock Holdings" posts for the year, below is the distribution of my portfolio at the end of December.

I received $150 from k1 Ventures through its capital reduction exercise. Adding it all up for the year, I had received $863.19 in 2015!
Since I will be working in mid-2016, I shall aim to achieve $1000 worth of dividend in 2016! This means putting some portion of salary into the stock market, maybe through dollar-cost averaging of STI ETF! Lastly, I shall write another post regarding my investing performance for 2015 as I started my records on 13 January of last year. Included will be breakdown of my Buys and Sells etc. Since I have not sat down to look at my records, writing that post is equally exciting for me!
Once again, Happy New Year and here's wishing everyone out there a prosperous and joyous year ahead! HUAT AH!
Monday, 30 November 2015
My Stock Holdings (November)
November brought down prices of a lot of my stocks, most notably Singapore Post and ST Engineering. I would probably not average down any time soon unless capitulation takes place. At the meantime, their dividends will keep me satisfied.

I had also bought k1 Ventures at a price of $0.20 on 10 November. This was prior to the capital reduction exercise conducted by the company, in which it gave out $0.015/share to shareholders. k1 Ventures is a investment company and has a great track record of delivering returns to shareholders. It is a bit of a pity that I had noticed this company so late. Between 30 October 2013 to 29 January of this year, the company had return $0.11 of dividends. That's 50% of the price I paid, excluding any capital gains! A risk involved in buying the stock at such a late stage is that most of the monies made from divestment gains had already been given out, hence returns may not be as great as before. Future investments made by k1 Ventures may not be as successful but given the track record, I am willing to place a small amount of money with them in hope of reaping a good returns. However, writing on hindsight with the price standing at $0.183 now, it is unnerving that the stock seem to drop with everything I might touch. The opposite of Midas Touch, perhaps the market is currently not optimal for new investments despite good fundamentals.
The pie chart shows the current distribution in my portfolio. In the month of November, I received dividends from Keppel Reit and Singpost. Hence the dividends I had received from start of the year to date is $713.19.
Sunday, 1 November 2015
My Stock Holdings (October)
Student life is killing me. At my last year of study, who knew things would be so tough. Final Year Projects, meetings upon meetings. Presentations and presentations. Deadlines and more deadlines. Nevertheless for my own sake and maybe to some extent yours, here's my holdings in October 2015.
No change in holdings but it seems that the market is doing well for the last month.

There are no dividends issued for the month of October, therefore it stands at $616.49.
A number of investment activities in the upcoming month:
Number one is to ballot for some IPO shares of Jumbo. A review of the IPO can be found in Mr IPO's website. I almost always ballot for IPO to sell on the first day unless its a very compelling business. Jumbo does not look to be the exception but I think Jumbo can open at least above $0.30. With only 2 million shares for public subscription, hope is not high to get the shares.
Number two is to indicate to opt for Keppel Reit's dividend in form of shares. I will explain this scheme/decision in the next post, hopefully before the next monthly report.
No change in holdings but it seems that the market is doing well for the last month.

There are no dividends issued for the month of October, therefore it stands at $616.49.
A number of investment activities in the upcoming month:
Number one is to ballot for some IPO shares of Jumbo. A review of the IPO can be found in Mr IPO's website. I almost always ballot for IPO to sell on the first day unless its a very compelling business. Jumbo does not look to be the exception but I think Jumbo can open at least above $0.30. With only 2 million shares for public subscription, hope is not high to get the shares.
Number two is to indicate to opt for Keppel Reit's dividend in form of shares. I will explain this scheme/decision in the next post, hopefully before the next monthly report.
Sunday, 27 September 2015
My Stock Holdings (September)
Have been busy with school work this month due to Final Year Project and job-finding (holy shit!) hence not much time to update.

I did buy Keppel Reit at $0.945 on 2 September as part of my income stocks. Also, dividends received in the month of September include $50 from ST Engineering and $86.05 from HPH Trust.
Dividends Year-to-Date: $616.49
Sunday, 30 August 2015
My Stock Holdings (August)
Portfolio at the end of August:

Note that it's a JPEG because I gave up using Google Sheets. Google keep republishing my charts although I unchecked that option. That is also why I deleted all my previous charts as it was overwritten.
So this month was quite a ride and my portfolio lost a value of $1000. Nothing to sweat about as I'm going for the long-term and not short term volatility. Looking forward, I really hope to buy in ST Engineering on the cheap especially since it had formed a bottom. Straco is really good for averaging down since I have only a small stake in it.
I'm also looking at Reits, in particular K-Reits and possibly Soilbuild Reits. We will see what Singapore market can offer.
In the dividend department, I received an additional $67.50 from Singapore Post.
Dividends Year-to-Date: $480.44
Note that it's a JPEG because I gave up using Google Sheets. Google keep republishing my charts although I unchecked that option. That is also why I deleted all my previous charts as it was overwritten.
So this month was quite a ride and my portfolio lost a value of $1000. Nothing to sweat about as I'm going for the long-term and not short term volatility. Looking forward, I really hope to buy in ST Engineering on the cheap especially since it had formed a bottom. Straco is really good for averaging down since I have only a small stake in it.
I'm also looking at Reits, in particular K-Reits and possibly Soilbuild Reits. We will see what Singapore market can offer.
In the dividend department, I received an additional $67.50 from Singapore Post.
Dividends Year-to-Date: $480.44
Wednesday, 22 July 2015
My Stock Holdings (July)
Bought Straco at $0.935 as the buy and sell price ($1) was at a huge difference. I had already known the good fundamentals that Straco possessed hence I casually queued at the buy price. Take a look at the EPS growth of Straco over the years since IPO. The CAGR of its EPS is calculated to be 33.08%.
Input that CAGR into the Future Value Calculator together with present value of 4.45cents (current full year EPS), you get an EPS value of $0.1857 in 5 years.
With a low P/E of 8, the stock price can be valued at $1.485 in 5 years. At historical P/E of 21.68 ( from POEMS Stocks Analytics), the stock price can be as high as $4.025.
The exact calculation method can be found here in my blog.
Overall portfolio for July is as follows:
Input that CAGR into the Future Value Calculator together with present value of 4.45cents (current full year EPS), you get an EPS value of $0.1857 in 5 years.
With a low P/E of 8, the stock price can be valued at $1.485 in 5 years. At historical P/E of 21.68 ( from POEMS Stocks Analytics), the stock price can be as high as $4.025.
The exact calculation method can be found here in my blog.
Overall portfolio for July is as follows:
Thursday, 9 July 2015
Singapore Post (S08.SI)
Sustainability of dividend
I like dividend stocks. The money is better in my pocket and tangible rather than getting stuck in the company balance sheet. That is the reason why I like Singpost so much. Having bought Singpost at $0.98 and yielding 6.25c dividend then, it was giving me 6.37% dividend yield. Recently, management raised dividend to 7c, amounting to 7.14% yield. While I welcome the dividend bump, I worry that it may not be sustainable. Many companies spam lots of dividend only to abruptly stop the flow of money when the cash pile depletes.I've compiled the changes in the cash pile of Singpost over the years and displayed it in the chart below.
As one can see, there is no definite pattern in the change of cash positions year to year. However, it can be seen that the data is skewed towards net increase. Even it out over the years, Singpost has actually increased its cash pile despite giving generous dividends. Increasing yearly dividend by 0.75c will only increase cash demand to the tune of $16.1m (based on outstanding shares of 2,146,774,225). That is less than 10% of the net cash increase during the latest financial year. Therefore, I would conclude barring unforeseen circumstance, Singpost is in good position to service that additional dividend payout.
P/E and P/B valuation
For the full year ended 2014, the EPS was 6.849c. Based on the price of $1.90, Singpost currently has a P/E of 27.7. The P/E is admittedly on the high side as I am more comfortable with stocks with P/E below 20.
Net asset value per share was 68.40c. P/B is 2.78. Similarly I'm usually not comfortable with P/B value above 1. When trawling the market for gems, I will look for P/B < 1 for safety margin and also for bargain.
From P/E and P/B valuation point of view, Singpost is indeed overvalued. A P/E of 27 is usually accorded to company with growth potential. Even though Singpost increased its revenue by 12% for the whole year, its underlying net profit only increased by 5.2%. This can be attributed to the low profit margin associated with the Logistics business Singpost is diversifying into. Mail segment is stagnating for a few years but is sadly, the cash cow of Singpost. Can such a high share price justify the high revenue growth but low bottomline growth of Singpost?
I would hold the stock myself since I bought it low and yield from my capital outlay is good. However, looking at valuations, Singpost is currently overpriced and there are better dividend yielding stocks out there.
Acquisitions and Disposals
In times of boom, companies had been known to go on an acquisition spree only to find that they had overpaid. Singpost, in its bid to diversify from its traditional mail business, had gone through a restructuring. The restructuring included acquisitions of logistics company and disposals of some traditional businesses, together with joint ventures and investments from Alibaba. I'm mainly concerned with the pace of acquisitions and the price that the management paid for the companies. Here's the rundown of the acquisitions and disposals Singpost did for the past year.
Acquisitions
- The Store House1
- Paid S$121,000 for 75% of shares with net tangible asset last recorded as S$11,000
- F.S Mackenzie2
- Consideration up to S$14.8m for entire paid up share capital
- Net asset value was S$5.4m
- Couriers Please Holdings3
- Acquisition at S$105m with prior net tangible asset recorded at roughly S$3m
- From the change in net profit after acquisition, it seems that Couriers Please Holdings added $9,417,000 to the net profit of Singpost (if assumption is correct, the P/E at which Singpost paid for Couriers Please seems reasonable)
- Famous Pacific Shipping4
- 90% holdings for NZ$3.6m with potential consideration up to NZ$8m because of potential earn-out consideration (don't really know what earn-out consideration is)
- Net asset value is NZ$816,104
- Hubbed Holdings5
- Quantium Solutions (Australia) acquired 30% of Hubbed Holdings for S$4.6m
- Quantium will get 5% more shareholdings if some pre-determined performance benchmark not met. If performance met, Quantium will pay an extra S$1.06m
- Net asset value of Hubbed Holdings is roughly S$1m
Disposals
- Novation Solutions & DataPost (HK)6
- Entirely disposed of both assets for $24,388,951
- Net tangible asset recorded as $19,214,000
- DataPost Pte Ltd7
- Sold 90% of shares for $39,299,511
- Net tangible asset was recorded as $30,690,000
I see that what Singpost paid was consistently much higher than the net asset value the acquired company possessed. However, I also feel that book value of company is not a good gauge for valuation the companies. Singpost itself is valued at nearly 3x P/B. Instead, the EPS of the company would be a better guide to see value. I will appreciate announcements to be like that of Couriers Please where impacts to net profits were shown. Looking at the announcement details, it would seem Singpost paid a reasonable price for Couriers Please and I would hope to extrapolate it to the other acquisitions.
With the exception of Couriers Please, the other acquisitions were relatively small and should not impact Singpost greatly if it was a bad investment. Furthermore, the capital expenditure for acqusitions is supported by disposals of companies whose considerations were significant.
From what I heard at Singpost's AGM, the M&A actions are not likely to stop just yet and there are more to come. Chairman was very supportive of the director that oversees M&A.
Earnings
As mentioned at the AGM, revenue rose 12% to the highest ever at S$920m. Underlying net profit similarly rose 5.2% to S$157m, highest ever. I am disappointed that profit has not kept up with the growth of revenue. This was actually mentioned at the AGM with one lady pointing out that net profit actually decreased. CEO of Singpost reasoned forcefully that in the process of transforming Singpost, there were many charges that cut into profits. They had to strip them out to show that the core businesses were actually doing well.
What was impressive about CEO Wolfgang Baier, was that he acknowledged the Mail business of Singpost was declining and never going back. 150 years of good business, it's not going to improve. Instead, Singpost had to transform to maintain its competitiveness. I liked his pragmatism and honesty. That is how problems get solved. Many management refused to acknowledge problems and refuse to change or improve. It was my first time attending an AGM and I was really impressed with the management, replying tough questions cordially and directly.
Conclusion
My confidence with Singpost remains strong especially after witnessing the strength of the management. On the day of AGM, it was announced that Alibaba invested a further S$279m in Singpost. Chairman kept reiterating that Alibaba was a tough investor to satisfy. Given that Alibaba had given Singpost their stamp of approval, I will likewise trust my investment in Singpost.
I will continue monitoring the growth of profit along with growth of revenue. It has been almost 2 years where profit growth had disappointed me. Perhaps at some point, I will realise Singpost is not going to be as profitable as before, but the time is not now.
Since buying Singpost at 2012, the dividends had paid almost 20% of my initial investment. Hopefully I will hold it till the stock pays itself. While I am not going to sell my holdings anytime soon, I think ultimately at $1.90, Singpost is overvalued and not a value buy for buyers. Dividend yield stands at 3.7% and while this is respectable, there are better companies out there that provides better yield and growth opportunities. Hence, people looking at Singpost, just pray it may drop. I may also increase my shareholdings if it ever drop low enough! (at least 5% div yield).
1. http://infopub.sgx.com/FileOpen/SGX_Ann.ashx?App=Announcement&FileID=307340
Thursday, 25 June 2015
My Stock Holdings (June)
June has been a busy period for me as I was busy packing stuff to go back to Singapore. It seemed that this month has been a volatile month due to the effect of Greece flirtation with the possibility of default.
There was no dividend issued for the month of June. Hence, dividend received remains at $278.25
**Edit: Chart removed because I set it to update with latest information -- not accurate info
ST Eng's price was pushed to a low of 3.24 before recovering recently to above 3.3, which is my average buy-in price. Many people in forums have expressed the opinions that ST Eng is richly valued in terms of P/E and P/B. I had see that the valuations are rich but dividend yield remains good. Given time, perhaps I'll see whether its dividend policy is sustainable and whether cash holdings is decreasing.
Singpost also recovered its price dip to above 1.90. This can be attributed to annual dividends increasing to 7c from 6.25c previously. Also, it divested some of its traditional business for a profit and that might also had lead to price increase. There's some points I'd like to read up on Singpost given time and they are listed as follows:
- Sustainability of dividend
- Debt obligations and dividends against earnings
- P/E and P/B valuations (Benjamin Graham had advocated sale of share when it reaches overvaluation state. Therefore, I want to see if Singpost is grossly overvalued and warrant a sale. It is unlikely though, as I regard Singpost as my crown jewel. I know falling in love with stock is no good..)
- Review growth of earnings (can be quite hard as Singpost recently changed its accounting practice)
Lastly, HPH Trust has been slowly dipping through the month of June while Bank of Ireland closed pretty high at the end of June amidst signs of Greece coming out of the talks with a solution.
**Edit: Chart removed because I set it to update with latest information -- not accurate info
Wednesday, 13 May 2015
My Stock Holdings (May)
Many companies are reporting their financial results this month and this lead to some price fluctuations. In my portfolio, all had reported their results with the exception of Bank of Ireland. As of now, I have no intention to sell any stock in my holding based on the results. Hence barely any change in the composition of my holding.
Also, I'm scouting for good stock to add to the portfolio and will buy in when I return to Singapore from my exchange.
One of my criteria for buying a stock is that it must give out dividend. Singpost, ST Eng and HPH Trust gives out dividend in my portfolio. Bank of Ireland is an exception as I recognise that it is a high growth stock and does not necessarily need to give out dividend.
As of May 2015, I received a total dividend of $278.25
**Edit 1: Revised dividend amount to a lower value as I accidentally calculated dividends I haven't receive.
**Edit 2: Chart removed because I set it to update with latest information -- not accurate info
Also, I'm scouting for good stock to add to the portfolio and will buy in when I return to Singapore from my exchange.
One of my criteria for buying a stock is that it must give out dividend. Singpost, ST Eng and HPH Trust gives out dividend in my portfolio. Bank of Ireland is an exception as I recognise that it is a high growth stock and does not necessarily need to give out dividend.
As of May 2015, I received a total dividend of $278.25
**Edit 1: Revised dividend amount to a lower value as I accidentally calculated dividends I haven't receive.
**Edit 2: Chart removed because I set it to update with latest information -- not accurate info
Tuesday, 13 January 2015
STI ETF Monthly Investment Plans in Singapore
It's been awhile since my last post. The reason being that I'm currently residing in Sweden for an overseas exchange programme and had been spending the time preparing for this exchange. The cost of living in Sweden is indeed high. A McChicken meal here costs 65 SEK, equivalent of nearly $12 in Singapore. And nope, the portion is the same. The huge expenditure that is going to come with this exchange got me thinking how to recoup the money back eventually. I can only depend on my fixed salary in the future to recoup this expenditure.
However, it is obviously known that the salary is going to be the same every month. How do you maximise this salary that is going to come in every month? INVEST! Like what Warren Buffett once said, "Pay Yourself First". Take out a portion of your salary each month and invest it in monthly investment plans that are provided by POEMS ShareBuilder Plan, OCBC Blue Chip Investment Plan (BCIP) and POSB Invest-Saver. These platforms allow you to invest as low as $100 each month at lower commissions. Once the GIRO instruction goes through, the designated amount will be deducted every month and invested into counters you chose at the start. I highly recommend that you choose one counter to invest in and that is the STI ETF counter. Without going too deep into the subject, STI ETF tracks the STI index and it has been shown that it is very hard to beat the index's return even for seasoned hedge fund managers. So instead of fretting which counters to invest in at the start, I am recommendeding just one: STI ETF
I did a comparison of the three low-cost investment plans and it is shown in the table below.

A few points to note here:
POEMS and OCBC allow partial redemption of the shares accumulated. POSB, on the other hand, only allows total redemption. This might be disadvantageous if you are in an urgent need of money. However, since I believe that once you sign up with these investment plans, you should be looking at the time frame of at least 5 years. Therefore this account should not be your piggybank when you want to go on a Europe trip or something. That said, if you happen to run out of money, you can opt to freeze the GIRO payment and continue earn dividends, rather than redeeming the shares for cash.
However, it is obviously known that the salary is going to be the same every month. How do you maximise this salary that is going to come in every month? INVEST! Like what Warren Buffett once said, "Pay Yourself First". Take out a portion of your salary each month and invest it in monthly investment plans that are provided by POEMS ShareBuilder Plan, OCBC Blue Chip Investment Plan (BCIP) and POSB Invest-Saver. These platforms allow you to invest as low as $100 each month at lower commissions. Once the GIRO instruction goes through, the designated amount will be deducted every month and invested into counters you chose at the start. I highly recommend that you choose one counter to invest in and that is the STI ETF counter. Without going too deep into the subject, STI ETF tracks the STI index and it has been shown that it is very hard to beat the index's return even for seasoned hedge fund managers. So instead of fretting which counters to invest in at the start, I am recommendeding just one: STI ETF
I did a comparison of the three low-cost investment plans and it is shown in the table below.
1) Buying-in Commission
POSB appears to be the lowest cost amongst the three at 1% flat rate. Suppose you choose to invest $100 per month, the commission rate of POEMS itself will be 6%! If you are investing $600 per month, then go for POEMS. $500-$600, you might want to go for OCBC BCIP.
2) Dividend Reinvestment
To me, this dividend reinvestment differentiates POEMS Sharebuilder Plan from the other two. Any dividend from STI ETF will be reinvested the following month. On the other hand, OCBC and POSB only credit the dividend into your bank account. Those who are privy to the power of compounding interest will know that reinvesting dividend will "snowball" your gains over the longer time horizon. Therefore POEMS wins in this aspect.
3) Misc Costs (Dividend Charges, Sell Commission)
After praising POEMS to the sky in point, it's time to point out the elephant in the room. The so-called "hidden costs" in POEMS are pretty high. Any dividend issued by STI ETF will be subjected to a $1 charge. Not mentioned in the table, there are also charges for scrip dividends, corporate actions, insufficient amount for GIRO. Furthermore, the commission that comes with selling the shares accumulated is definitely a downer. From all this, I gather POEMS is trying to attract people that are willing to invest more per month such that all this costs become negligible.
Edit: Self-assisted selling using POEMS is possible at min $25
Edit: Self-assisted selling using POEMS is possible at min $25
4) Underlying ETF
The underlying STI ETF that each platform buys differs. However, the difference is minute and should not concern us. For general info, SPDR has a lot size of 1000 shares while Nikko AM has lot size of 100 shares. Also SPDR charges a fund fee of 0.3% per year while Nikko AM charges 0.39%. Again, this only concerns the people running the three platforms.
5) Partial/Total Redemption
EDIT (18/1/16): Partial redemption of STI ETF units is now possible for POSB.
Conclusion:
If you are investing upwards of $500, go with POEMS for the dividend reinvestment. However, if you are still uncomfortable with the numerous charges that POEMS carries, by all means go with OCBC BCIP.
If anything between $100-$500, choose POSB because of the low commission cost. Also, if you are new to investing, POSB is good as it is more clear cut with the charges.
As much as I would like to start this monthly investment plans right now, I'm a poor student that can only afford to invest $100 a month at most. However, I really like the automatic dividend reinvestment provided by POEMS Sharebuilder. Therefore, I'd prefer to start with the Sharebuilder plan when I draw a regular paycheck upon graduation.
Saturday, 13 December 2014
Hutchison Port Trust (NS8U.SI)
Hutchison Port Trust (HPH Trust) started trading with much fanfare on 2012. Listed in SGX, it is touted as the world's first publicly traded container port business trust. HPH Trust owns interest in container port assets in Hong Kong and Shenzhen - two of the busiest ports in the world. In 2013, its container berth handled a combined throughput of 22.8m twenty-foot equivalent unit (TEU).
HPH Trust is one of the thirty components in Straits Times Index (STI), having replaced F&N in 3 April 2013. As of 13 December 2014, it is also the highest yielding stock within STI at 7.8%. On 27 October 2014, the company ended the third quarter with an operating profit of HK$1.24 billion, a 3.5% increase year-on-year.
Given the high dividend that HPH Trust pays out every year, one should be prudent and check whether these dividends are sustainable into the future. The key objective of the Trustee-Manager was stated in the 2013 Annual Report as the following: "... to provide unitholders with stable and regular distributions and long-term growth in distributions per unit (DPU)" However, a quick look at the DPU since IPO was actually decreasing.

This also points out the deceptive nature of dividends yield. Dividend yield is based on past dividends and definitely not indicative of future dividends. Furthermore, dividend yield is based on current stock price and this means that falling stock price inflates dividend yield. For instance, HPH Trust indicated that it is distributing 45.88 HK cents in its IPO Prospectus and that translated to 5.8% dividend yield based on IPO price of US$1.01. However, due to the subsequent price fall to US$0.78, the yield had been bumped up to 7.5%. Hence, a lesson to take home is that stock purchase should not be based solely on the dividend yield number.
Besides the falling distributions, there are also a few points that does not paint a rosy picture of its financials. The first point is the enormous payout ratio. In 2011, the payout ratio is 167%. Next year, it increased to 199% and subsequently stood at 213% in 2013. Such high numbers indicated the distributions were likely unsustainable and that might have been the reason why distributions were falling.

The trust might be able to give out that much dividends with its positive operating cash flow but quick inspection of the cash pile over the years indicated that it is dipping into its coffers to give such high dividends. In other words, the distributions for the past 3 years are unlikely to be sustainable. The Trust must find ways increase its profits otherwise unitholders will be looking at reduced distributions.
Another point of concern is the liabilities of the Trust. While the debt to assets ratio are pretty reasonable at below 50%, we can see that significant portion of the liabilities have been transferred to Current Liabilities recently. Current Liabilities are debts and obligations due within one year and with significant increase in that amount, a cut in dividend might be plausible in the near future.

With all these data, is HPH Trust properly valued at US$0.69? Analysts opinions were quite differing with UBS having at TP of US$0.67 and DBS at US$0.78. However, one common point in both reports was that the management was considering whether to match cash flow generation to distribution payout more closely. Given that cash flow were negative in 2012 and 2013, distributions look to be suppressed in the mid- to long-term.
Having bought HPH Trust at US$0.68 way back in 21 November 2013, I am fairly pessimistic about the dividend outlook. However, since I am comfortable with dividend yield above 6.5%, I will hold on to it until capital gains (around US$0.725) justify me switching out to other dividend stocks.
Sunday, 7 December 2014
ST Engineering (S63.SI)
Amidst the recent drop in oil prices, there are gems to be found. Some are oil-related stocks like Keppel Corp which may or may not have been oversold compared to crude oil price. Others, like ST Engineering (S63.SI) are dragged down by the pessimistic market. Upon some search on how oil price affects the business of ST Eng, I found this statement in the company's 2009 annual report:
"Oil prices have been on the uptrend since the beginning of the year and was around US$70 at year’s close. High oil prices would have a negative impact on the Group’s customers in the Aerospace sector, and this may in turn impact the Group’s performance. However, such an environment of high costs could present opportunities for third-party MRO providers like ST Aerospace, as airlines outsource more MRO work in an effort to contain costs."
Although a report in 2009 is too outdated for my liking, I will conclude that oil price does not affect the company negatively at the very least. Due to its slump in stock price, the dividend yield had been bumped up to 4.7% from 4+% previously. Attractive, in my opinion.
However, as fate would have it, I chanced upon an article which highlighted the hidden risk of dividend stocks. In the article, SIA Engineering was cited as an example where high dividend payout did not mean that it was a good buy. This was due to its unsustainable dividend policy where dividends regularly exceeds its earnings. The shortfall between earnings and the dividends have to been patched up using its cash pile.
Following what the article did, I went to compile a list of ST Eng's financial and dividend history as below.
The Earnings Per Share has been increasing steadily throughout the years with a slight bump in the wake of 2008 Financial Crisis. Dividends had been steady since 10 years ago. With decreasing payout ratio, it seemed that ST Eng had been prudent with its cash pile. This also implies that ST Eng does not need to dip into its cash reserves in order to maintain same dividend payout even if EPS drops. ie Sustainable Dividend Policy
"Oil prices have been on the uptrend since the beginning of the year and was around US$70 at year’s close. High oil prices would have a negative impact on the Group’s customers in the Aerospace sector, and this may in turn impact the Group’s performance. However, such an environment of high costs could present opportunities for third-party MRO providers like ST Aerospace, as airlines outsource more MRO work in an effort to contain costs."
Although a report in 2009 is too outdated for my liking, I will conclude that oil price does not affect the company negatively at the very least. Due to its slump in stock price, the dividend yield had been bumped up to 4.7% from 4+% previously. Attractive, in my opinion.
However, as fate would have it, I chanced upon an article which highlighted the hidden risk of dividend stocks. In the article, SIA Engineering was cited as an example where high dividend payout did not mean that it was a good buy. This was due to its unsustainable dividend policy where dividends regularly exceeds its earnings. The shortfall between earnings and the dividends have to been patched up using its cash pile.
Following what the article did, I went to compile a list of ST Eng's financial and dividend history as below.
| Year | EPS (cents) | NAV (cents) | Dividends (cents) | Payout Ratio |
|---|---|---|---|---|
| 2004 | 12.26 | 47 | 12.39 | 101.06% |
| 2005 | 13.64 | 51.2 | 13.6 | 99.71% |
| 2006 | 15.15 | 53.1 | 15.11 | 99.74% |
| 2007 | 16.95 | 54.7 | 16.88 | 99.59% |
| 2008 | 15.82 | 52.7 | 15.8 | 99.87% |
| 2009 | 14.78 | 52.09 | 13.28 | 89.85% |
| 2010 | 16.21 | 53.38 | 14.55 | 89.76% |
| 2011 | 17.28 | 57.79 | 15.5 | 89.70% |
| 2012 | 18.76 | 61.51 | 16.8 | 89.55% |
| 2013 | 18.73 | 68.14 | 15 | 80.09% |
The Earnings Per Share has been increasing steadily throughout the years with a slight bump in the wake of 2008 Financial Crisis. Dividends had been steady since 10 years ago. With decreasing payout ratio, it seemed that ST Eng had been prudent with its cash pile. This also implies that ST Eng does not need to dip into its cash reserves in order to maintain same dividend payout even if EPS drops. ie Sustainable Dividend Policy
Having bought half a lot of ST Engineering at $3.37, I would seek to complete my other half of the lot by waiting at $3.24. ST Engineering is a very solid company as I see it as a company that is effectively backed by SAF. During NSF days, almost all the vehicles were serviced or modified by ST Kinetics, a subsidiary of ST Engineering. Following Warren Buffet's advice, I would still see ST Engineering existing 50 years down the road and thus bought the stock amidst some market turmoil.
Friday, 29 August 2014
Dividends: A Passive Income
Dividends are payment made by a company to its shareholders, usually out of its profits. Dividend policy varies from company to company. For example, some company do not pay dividends regularly. Others, like Singpost, pays dividends every quarter. Hutchison Port Trust pays bi-annually and Straco pays yearly.
People view dividends as an added bonus when they trade stocks. For an investor, dividends may be the make-or-break decision for buying the stock. This is because in the long run, dividends eventually becomes your passive income. One good example is Dividend Warrior, who regularly blogs about his dividend returns and income. In the latest 13 August 2014 post, he had accumulated $10,262 of dividends. These dividends are based on a capital of $222,560. That is my idol right there!
Usually when I tries to preach about the importance of investing for passive income, the usual response is that the capital is too low to start. However, I beg to differ. Everyone must start at some point and when better to start than now? For young investors, the most precious asset you own is TIME! Given that your capital returns an interest of 5% per annum and that you reinvest your interests, $1000 will become $2000 in 14.4 years. Make your money work as early as possible! In addition, SGX will cut lot size from 1000 shares to 100 shares by 19 January 2015. Currently, you can only buy stocks in blocks of 1000 shares, or 1 lot. By next year, you can purchase stocks in blocks of 100 shares. This means that blue chips like DBS or Keppel Corp will be more affordable to the public.
The gains to be made from investments are from either capital gains from rising share price or dividends. Although capital gains are usually gained in a shorter period of time and thus more satisfying, a smart investor will realise that dividends pay well in the long term. Everyone looks forward to retirement eventually and living expenses after retirement generally comes from CPF. But what if you manage to build a sizeable portfolio by the time you retire? Instead of putting your cash into a saving accounts which yields less than 1%, put it into dividend-yielding stocks like REITs and Trusts. These two types of stocks usually yield at least 5% dividend a year. In addition to CPF withdrawal, dividend payment can really add to the comfort of your retirement. For me, investment is really about building a portfolio that can eventually provide enough dividends for financial freedom/retirement. That should also be the objective that other have for investing.
As a result of my love for dividends, I had been slowly buying dividend stocks like Trusts and REITs the past 2 years. Below is my humble dividend records in the last two years of investing:

Do note that Dividend Yield reflects average yield of only dividend-bearing stocks while Portfolio Dividend Yield is the dividend yield based my enlarged portfolio capital.
I've highlighted the benefits of dividends in investing and also briefly covered how time is our most precious asset. Also, I've mentioned about two categories of stocks, REITs and Trusts, which bears comparatively higher dividend yield. Hopefully after this post, you might give investing a good thinking over and start your own investing journey!
People view dividends as an added bonus when they trade stocks. For an investor, dividends may be the make-or-break decision for buying the stock. This is because in the long run, dividends eventually becomes your passive income. One good example is Dividend Warrior, who regularly blogs about his dividend returns and income. In the latest 13 August 2014 post, he had accumulated $10,262 of dividends. These dividends are based on a capital of $222,560. That is my idol right there!
Usually when I tries to preach about the importance of investing for passive income, the usual response is that the capital is too low to start. However, I beg to differ. Everyone must start at some point and when better to start than now? For young investors, the most precious asset you own is TIME! Given that your capital returns an interest of 5% per annum and that you reinvest your interests, $1000 will become $2000 in 14.4 years. Make your money work as early as possible! In addition, SGX will cut lot size from 1000 shares to 100 shares by 19 January 2015. Currently, you can only buy stocks in blocks of 1000 shares, or 1 lot. By next year, you can purchase stocks in blocks of 100 shares. This means that blue chips like DBS or Keppel Corp will be more affordable to the public.
The gains to be made from investments are from either capital gains from rising share price or dividends. Although capital gains are usually gained in a shorter period of time and thus more satisfying, a smart investor will realise that dividends pay well in the long term. Everyone looks forward to retirement eventually and living expenses after retirement generally comes from CPF. But what if you manage to build a sizeable portfolio by the time you retire? Instead of putting your cash into a saving accounts which yields less than 1%, put it into dividend-yielding stocks like REITs and Trusts. These two types of stocks usually yield at least 5% dividend a year. In addition to CPF withdrawal, dividend payment can really add to the comfort of your retirement. For me, investment is really about building a portfolio that can eventually provide enough dividends for financial freedom/retirement. That should also be the objective that other have for investing.
As a result of my love for dividends, I had been slowly buying dividend stocks like Trusts and REITs the past 2 years. Below is my humble dividend records in the last two years of investing:
Do note that Dividend Yield reflects average yield of only dividend-bearing stocks while Portfolio Dividend Yield is the dividend yield based my enlarged portfolio capital.
I've highlighted the benefits of dividends in investing and also briefly covered how time is our most precious asset. Also, I've mentioned about two categories of stocks, REITs and Trusts, which bears comparatively higher dividend yield. Hopefully after this post, you might give investing a good thinking over and start your own investing journey!
Sunday, 6 July 2014
Financial Jargon
Ever saw P/E somewhere in stocks discussion forum? Or EPS in the annual reports of companies? P/E and EPS are some of the financial terms you'll find in the world of investing. Before I start my first case study, it is important to know what the terms mean. They help one to decide the intrinsic performance of a company as well as the valuation of the company in the market. Here are some of the more common terms and also what it represents.
P/E (aka Price to Earning Ratio)
The most common metric that you will find. Normally found alongside stock quotes. The number can be found by the equation: P/E = Stock Price / Earnings
By Earnings, it is meant as Earnings Per Share
P/E ratio helps to value the stock of a company. It is done by comparing the stock price relative to the income generated. For example, if SingPost has a P/E of 26, the buyer is actually paying $26 for every $1 that the company earns. By comparing the P/E ratio of different companies within the same industry, one can find out which companies are "cheaper".
However, P/E is not a clear cut metric to buy stocks. P/E may be higher because the company is expanding fast. P/E may be low because company is in a unpopular industry. P/E will not even exist if the company is loss-making. You can use more ratios introduced further on to determine whether a company is a "good buy".
EPS (aka Earnings Per Share)
The earnings per share made by the company in a financial year. Normal stated in annual reports. Calculated according to the equation: EPS = Net Profit / Total Shares Outstanding
For example, SingPost has a net profit of $128,175,000 and has an outstanding ordinary share of 1,899,921,000. Using the formula, you'll find that the EPS is 6.75 cents as reported in the annual report. Going a step further to find P/E ratio, the stock price of SingPost is currently at $1.765 while EPS is $0.0675.
Dividing stock price by EPS, P/E = 26.14.
P/B (aka Price to Book Ratio)
Book here refers to the Net Asset Value (NAV) of the company. P/B ratio helps one determine whether the stock is priced at a discount or premium to its tangible assets. ( < 1 represents a discount while > 1 represents a premium)
Comparing P/B ratios between companies of similar industries will help determine which one is a good catch. This is especially important because there are different "standard" of P/B in each industry. For example, land developer normally trade at a discount to NAV while technology stocks trades at a premium.
Dividend Yield
When the company chooses to distribute part of its earnings to the shareholders, the money is termed as the dividend. Dividend yield is calculated by the equation: Annual Dividend / Current Stock Price
Dividend distribution is definitely not indicative of a company's strength. Apple Inc, for example, famously did not pay dividend from 1996 to 2012. The stock price was not held back AT ALL.
However, companies that give away dividend is an added bonus as the cash given back is in your pocket. Furthermore, it shows that the company does have the cash and not just "cooking the book".
SGX had once undergone a S-Chip Scandal episode where it involved a number of China-based companies listed in Singapore. The companies had suddenly gone bankrupt and was later found to be guilty of accounting fraud. Regular dividend distribution acts as a detector to see a company is potentially fraudulent as real hard cash has to be paid out.
These four financial metrics are the most common metrics I use to filter out a preliminary list of stocks to invest. Google Finance provides a very good platform to filter out a list based on your required criteria. From there, you research deeper on those shortlisted companies and pick the most promising one. This is what "doing your homework" is when it comes to investing.
P/E (aka Price to Earning Ratio)
The most common metric that you will find. Normally found alongside stock quotes. The number can be found by the equation: P/E = Stock Price / Earnings
By Earnings, it is meant as Earnings Per Share
P/E ratio helps to value the stock of a company. It is done by comparing the stock price relative to the income generated. For example, if SingPost has a P/E of 26, the buyer is actually paying $26 for every $1 that the company earns. By comparing the P/E ratio of different companies within the same industry, one can find out which companies are "cheaper".
However, P/E is not a clear cut metric to buy stocks. P/E may be higher because the company is expanding fast. P/E may be low because company is in a unpopular industry. P/E will not even exist if the company is loss-making. You can use more ratios introduced further on to determine whether a company is a "good buy".
EPS (aka Earnings Per Share)
The earnings per share made by the company in a financial year. Normal stated in annual reports. Calculated according to the equation: EPS = Net Profit / Total Shares Outstanding
For example, SingPost has a net profit of $128,175,000 and has an outstanding ordinary share of 1,899,921,000. Using the formula, you'll find that the EPS is 6.75 cents as reported in the annual report. Going a step further to find P/E ratio, the stock price of SingPost is currently at $1.765 while EPS is $0.0675.
Dividing stock price by EPS, P/E = 26.14.
P/B (aka Price to Book Ratio)
Book here refers to the Net Asset Value (NAV) of the company. P/B ratio helps one determine whether the stock is priced at a discount or premium to its tangible assets. ( < 1 represents a discount while > 1 represents a premium)
Comparing P/B ratios between companies of similar industries will help determine which one is a good catch. This is especially important because there are different "standard" of P/B in each industry. For example, land developer normally trade at a discount to NAV while technology stocks trades at a premium.
Dividend Yield
When the company chooses to distribute part of its earnings to the shareholders, the money is termed as the dividend. Dividend yield is calculated by the equation: Annual Dividend / Current Stock Price
Dividend distribution is definitely not indicative of a company's strength. Apple Inc, for example, famously did not pay dividend from 1996 to 2012. The stock price was not held back AT ALL.
However, companies that give away dividend is an added bonus as the cash given back is in your pocket. Furthermore, it shows that the company does have the cash and not just "cooking the book".
SGX had once undergone a S-Chip Scandal episode where it involved a number of China-based companies listed in Singapore. The companies had suddenly gone bankrupt and was later found to be guilty of accounting fraud. Regular dividend distribution acts as a detector to see a company is potentially fraudulent as real hard cash has to be paid out.
These four financial metrics are the most common metrics I use to filter out a preliminary list of stocks to invest. Google Finance provides a very good platform to filter out a list based on your required criteria. From there, you research deeper on those shortlisted companies and pick the most promising one. This is what "doing your homework" is when it comes to investing.
Subscribe to:
Posts (Atom)